Random Forest Example
[Machine-Learning Python
Written on October 21, 2018
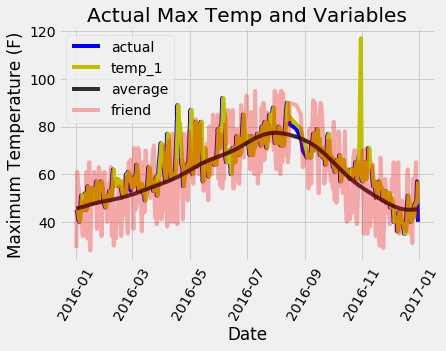
We want to predict the max temperature for tomorrow in Seattle, WA using one year of past weather data.
Data Preparation
Data visualization
import numpy as np
import pandas as pd
import matplotlib.pyplot as plt
from sklearn.model_selection import train_test_split

features = pd.read_csv('temps.csv')

# One-hot encode the data using pandas get_dummies
features = pd.get_dummies(features)

# Use numpy to convert to arrays
# Labels are the values we want to predict
labels = np.array(features['actual'])
# Remove the labels from the features
# axis 1 refers to the columns
features= features.drop('actual', axis = 1)
# Saving feature names for later use
feature_list = list(features.columns)
# Convert to numpy array
features = np.array(features)

# Split the data into training and testing sets
train_features, test_features, train_labels, test_labels = train_test_split(features, labels, test_size = 0.25, random_state = 42)
Establish Baseline
We would like our model works better than a reasonable guess. For simplicity, lets choose the historical average as the predicted max temperature.
# The baseline predictions are the historical averages
baseline_preds = test_features[:, feature_list.index('average')]
# Baseline errors, and display average baseline error
baseline_errors = abs(baseline_preds - test_labels)
print('Average baseline error: ', round(np.mean(baseline_errors), 2))
Average baseline error:  5.06
Train Model
Train model and make prediction on test sets.
# Import the model we are using
from sklearn.ensemble import RandomForestRegressor
# Instantiate model with 1000 decision trees
rf = RandomForestRegressor(n_estimators = 1000, random_state = 42)
# Train the model on training data
rf.fit(train_features, train_labels);

# Use the forest's predict method on the test data
predictions = rf.predict(test_features)
# Calculate the absolute errors
errors = abs(predictions - test_labels)
# Print out the mean absolute error (mae)
print('Mean Absolute Error:', round(np.mean(errors), 2), 'degrees.')

# Calculate mean absolute percentage error (MAPE)
mape = 100 * (errors / test_labels)
# Calculate and display accuracy
accuracy = 100 - np.mean(mape)
print('Accuracy:', round(accuracy, 2), '%.')
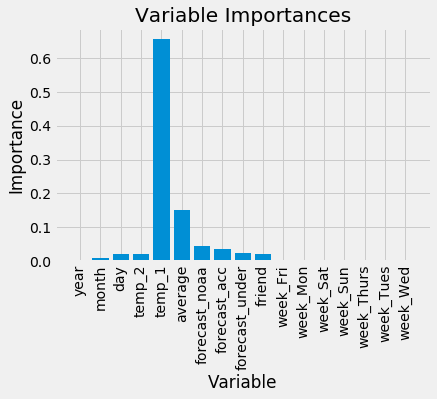
Performance Metrics
# Get numerical feature importances
importances = list(rf.feature_importances_)
# List of tuples with variable and importance
feature_importances = [(feature, round(importance, 2)) for feature, importance in zip(feature_list, importances)]
# Sort the feature importances by most important first
feature_importances = sorted(feature_importances, key = lambda x: x[1], reverse = True)
# Print out the feature and importances
[print('Variable: {:20} Importance: {}'.format(*pair)) for pair in feature_importances];


# Import matplotlib for plotting and use magic command for Jupyter Notebooks
# Set the style
plt.style.use('fivethirtyeight')
# list of x locations for plotting
x_values = list(range(len(importances)))
# Make a bar chart
plt.bar(x_values, importances, orientation = 'vertical')
# Tick labels for x axis
plt.xticks(x_values, feature_list, rotation='vertical')
# Axis labels and title
plt.ylabel('Importance'); plt.xlabel('Variable'); plt.title('Variable Importances');
Archive
Machine-Learning Python Matlab Trading Strategy SQL R Algorithm